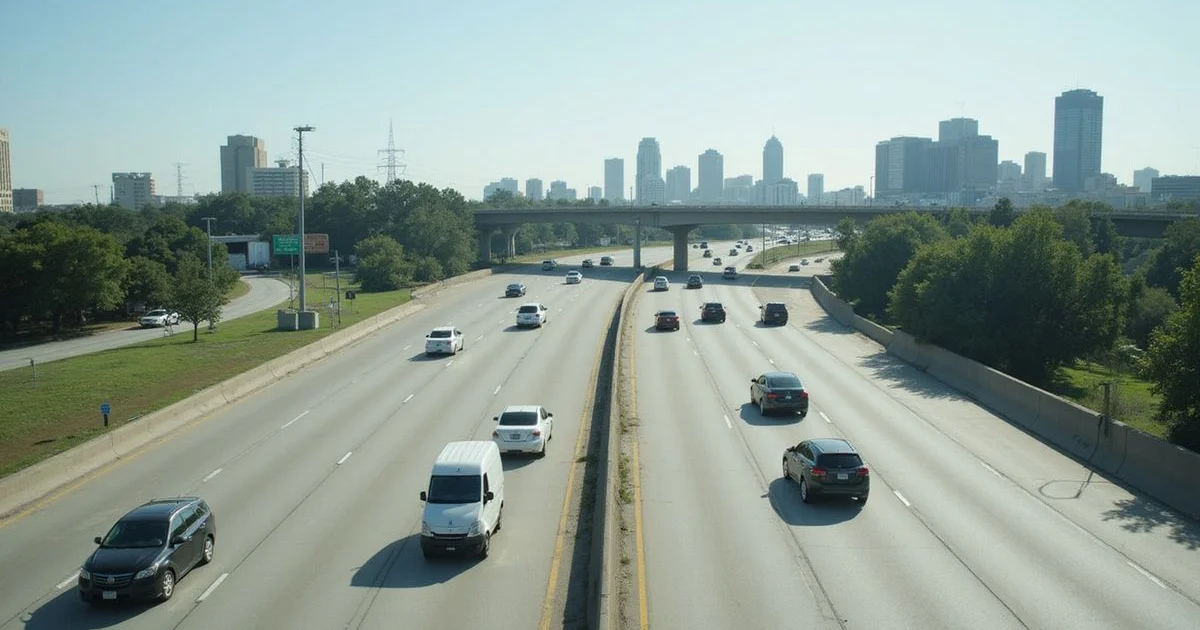
How should I read commute times on your pages?
Our pages display free-flow times, which simply means the drive with zero traffic. You should treat this number as the absolute floor of your trip, rather than a guaranteed arrival time.
We see business owners and homebuyers struggle with unpredictable map apps constantly. Making a smart real estate decision requires knowing the free flow commute time meaning.
This metric strips away the unpredictable delays to give you a reliable baseline. We use it across our site, including our new apartments near work page, to measure every building fairly.
The platform gives you three concrete pieces of data:
- The absolute fastest the trip can be (zero traffic)
- The exact route taken
- The known congested segments along that path
We pair this baseline with those congested segments, telling you much more than a generic average ever could.

Why free-flow, and not an average?
Using the free flow commute time meaning gives you a consistent baseline instead of a moving target. Average commute times depend on too many daily variables.
Daily factors that skew averages:
- The day of the week
- Your exact start time
- Weather changes and school calendars
- Unexpected crashes and construction zones
A 2025 TomTom traffic index report showed evening rush hour in places like Houston can add up to 18 minutes to a standard 30-minute drive. A single average looks precise but often fails on your actual morning.
Our free-flow number tells you the absolute fastest the trip can be. The map then highlights the specific bottlenecks where worst-case scenarios happen.
| What we show | What it means | How to use it |
|---|---|---|
| Free-flow minutes | The drive with no traffic | Your floor: it won’t be faster |
| Named congested segments | Where the route backs up | Expect delays here at peak times |
| Toll line | What the route costs | Add it to your monthly bill |
What are TTI congested segments?
The Texas A&M Transportation Institute (TTI) analyzes statewide traffic data to identify the worst bottlenecks. If you frequently drive the TTI congested roads Houston tracks, you already know the frustration.
The 2025 TTI Urban Mobility Report lists the West Loop of I-610 and the Eastex Freeway as some of the most jammed segments in the entire state.
When a route to your job uses one of those notorious segments, we point it out. For example, driving from Katy to the Energy Corridor might flag the I-10 stretch near SH 6 and the Beltway.
A trip from the Heights to the Texas Medical Center usually highlights the West Loop delay.
Test the drive yourself
Before you sign a lease or buy a property, drive the route once at your actual morning hour. Checking a live map app during a weekday morning commute works well too. Our numbers provide the minimum time and highlight the trouble spots. Your test drive fills in the real-world blanks.

The 20-minute rule for employer pages
We launch a dedicated employer page when five or more tracked buildings sit within 20 free-flow minutes of that workplace. This strategy ensures you have real, actionable housing choices with a genuinely short commute.
Until a hub hits that five-building threshold, each employer stays listed as a section on our Near Work page. That layout still shows surrounding areas, commute routes, and toll costs.
Major employment centers on the tracker include:
- The Texas Medical Center (TMC)
- The Energy Corridor
- ExxonMobil campus
- Chevron Downtown
- George Bush Intercontinental Airport (IAH)
- NASA Johnson Space Center
- The Houston Ship Channel
What about shift work?
If you work very early or late shifts, your commute time estimate often matches the free-flow numbers. A 6 AM start frequently beats the worst morning backups.
Leaving work at 5 PM puts you right in the middle of peak congestion. Traffic data shows the heaviest delays consistently cluster between 5 PM and 6 PM.
Our detailed guide on TMC shift commutes answers specific questions about garage access and staggered hours. Planning around these peak windows saves you significant time.
How to estimate your own buffer
Start your planning by looking at the free-flow time on the property card. Then, check the named congested segments listed for your route.
If your drive hits one of those segments during peak hours, you must add extra time. Morning rush hours typically peak between 7 AM and 8 AM, while evening delays are worst from 5 PM to 6 PM.
A test drive at your real start time provides the most accurate data. Live map checks on a Tuesday or Wednesday also offer great insight into your commute time estimate.
Several factors will change your required buffer throughout the year:
- Heavy rain and severe weather
- School drop-off schedules returning in August
- Active construction zones shifting lanes
- Major local events affecting freeway access
A quick highway trip in July might turn into a frustrating crawl by mid-September.
How do I put this to use?
Begin with the free-flow time, identify the named delay segments, and decide how much extra buffer you need.
Our comprehensive commute-first guide walks you through picking the right neighborhoods step by step.
Provide your specific job address and typical hours. We map out buildings based on the free flow commute time meaning, delivering a complete report the same day during business hours.